Aura MLS Plots
MLS Daily Stratospheric and Mesospheric Daily Plots
Contact: Gloria Manney

|
Stratospheric EqL/θ Plots
Daily MLS H2O, O3, CO, N2O, HNO3, ClO, HCl, OH, and HCN equivalent latitude (EqL) zonal means plotted as a function of potential temperature (θ), with overlaid contours of scaled potential vorticity. |
|
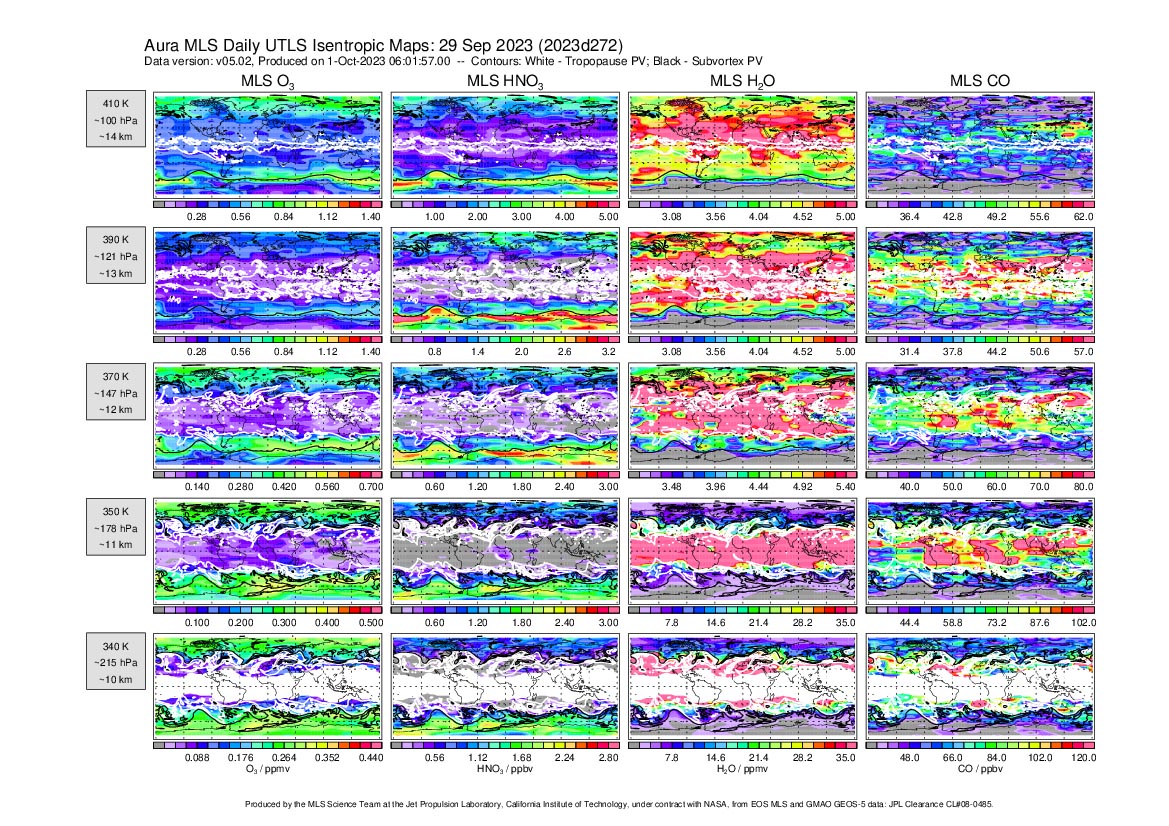
UTLS Isentropic Plots
Daily isentropic maps of MLS (left to right) ozone (ppmv), nitric acid (ppbv), water vapor (ppmv) and carbon monoxide (ppbv) in the upper troposphere/lower stratosphere, with white overlaid contours showing the tropopause (4.5 'PVU') and black overlaid contours showing the bottom of the polar vortex in the winter hemisphere. |
|
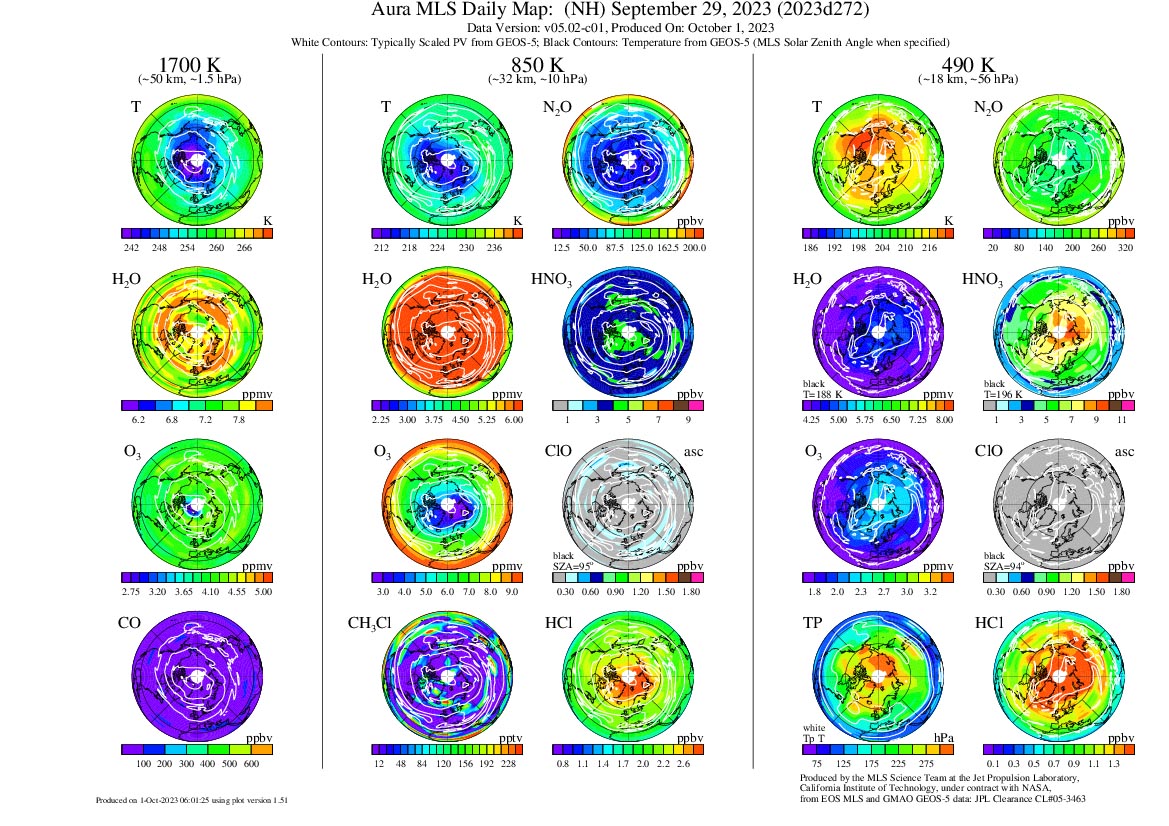
Stratospheric Polar Projection Plots for NH and SH
Daily plots of:
|
|
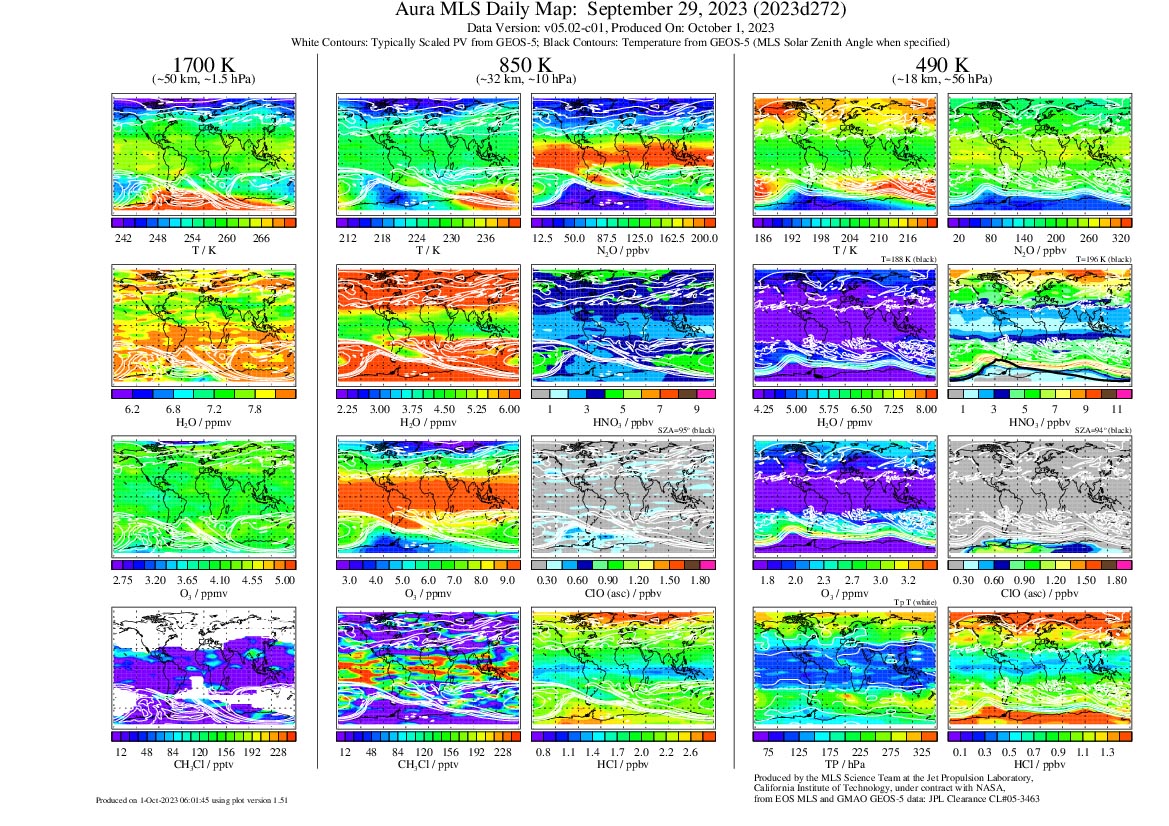
Stratospheric Cylindrical Projection Plots
Daily plots of:
|
|
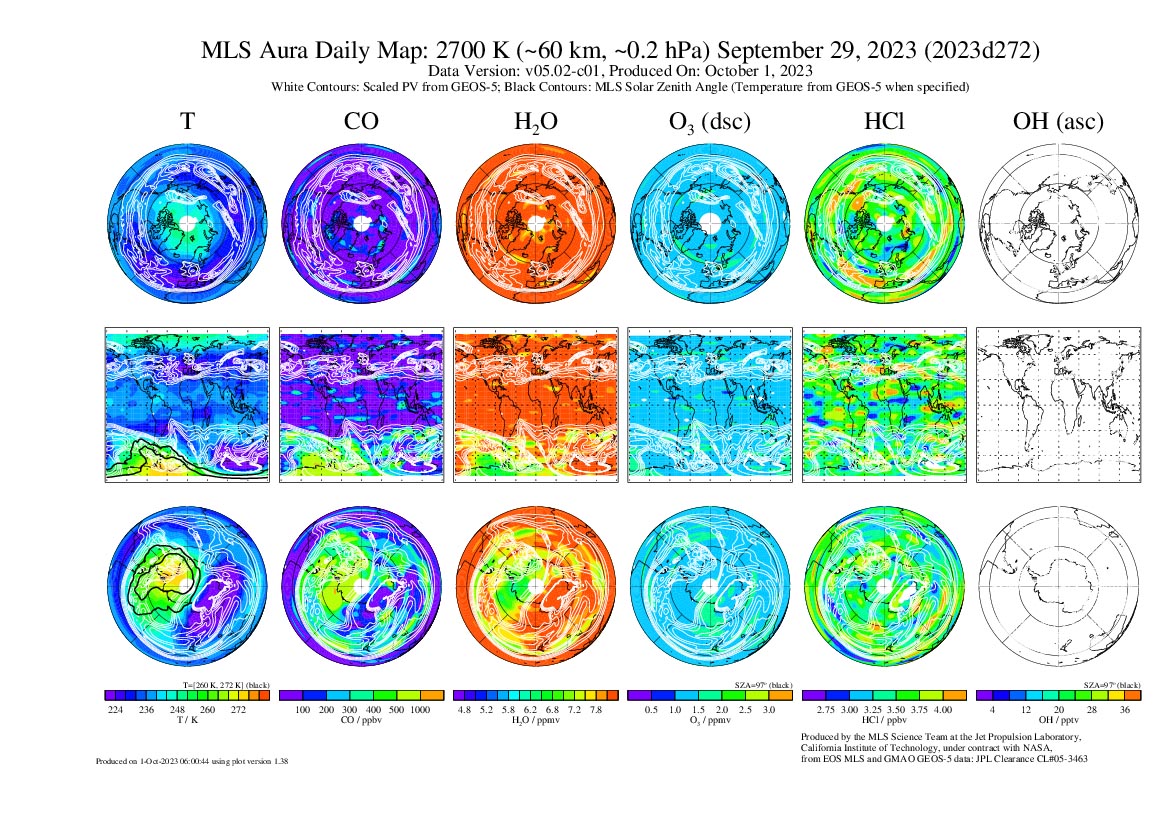
Mesospheric Plots
Daily plots of temperature, CO, H2O, O3, HCl, OH at θ = 2700K (~60 km, 0.2 hPa). Includes cylindrical projection plots and polar plots for NH and SH. |
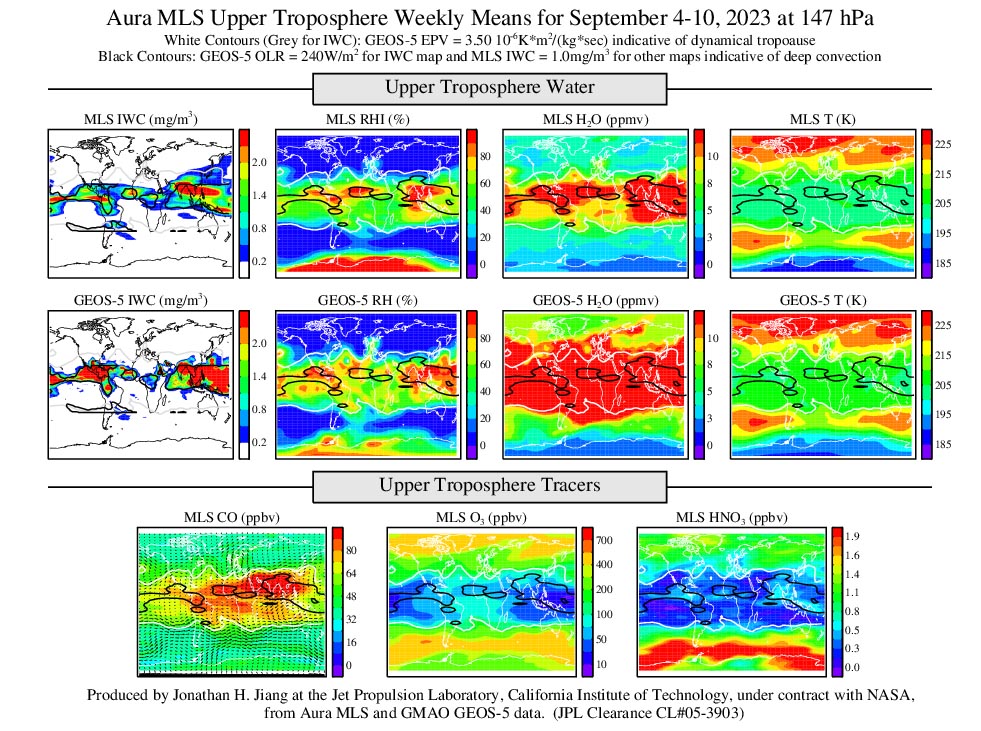
MLS Weekly Tropospheric Data Plots
Contact: Jonathan Jiang
|
These are global maps of weekly-average MLS measurements of upper tropospheric cloud ice, relative humidity with respect to ice, watervapor, CO, O3and temperature. Included for comparison are maps for the same period of GMAO GEOS-5 first look output for water vapor. Maps are currently available for MLS v4 and v5 data at 100, 147, and 215 hPa pressure surfaces. White contours show potential vorticity value (3.5x10⁶ Km2kg-1s-1) indicative of the dynamical tropopause. Black contours on the cloud ice maps show GMAO outgoing longwave radiation (OLR) value of 240 W/m2. Black contours on the other maps show MLS cloud ice values indicative of deep convection (0.3 mg/m3 at 100 hPa, 1 mg/m3 at 147 hPa, and 3 mg/m3 at 215 hPa). The MLS data have been screened to exclude situations where clouds impact the results. |
Daily Meteorological Plots
Contact: Gloria Manney
|
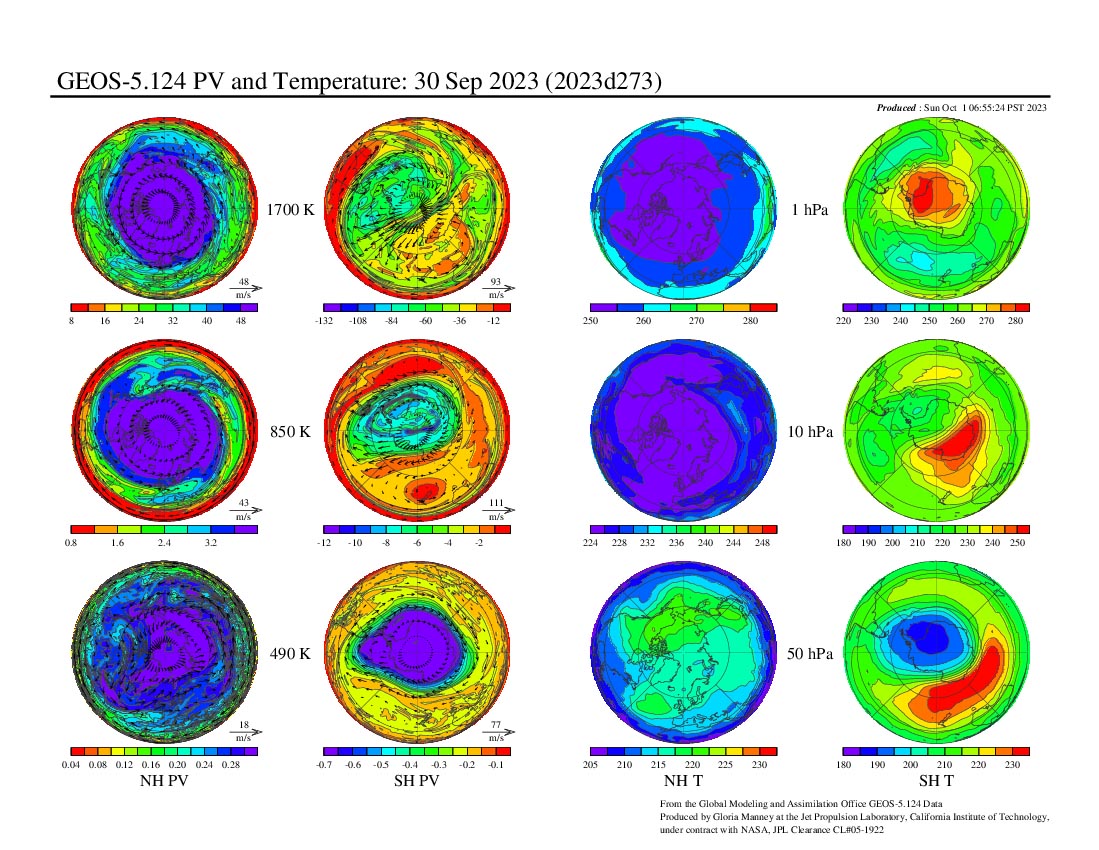
Stratospheric Potential Vorticity (PV) and Temperature Plots
These plots are from NASA's Global Modeling and Assimilation Office (GMAO), Goddard Earth Observatory System (GEOS) |
|
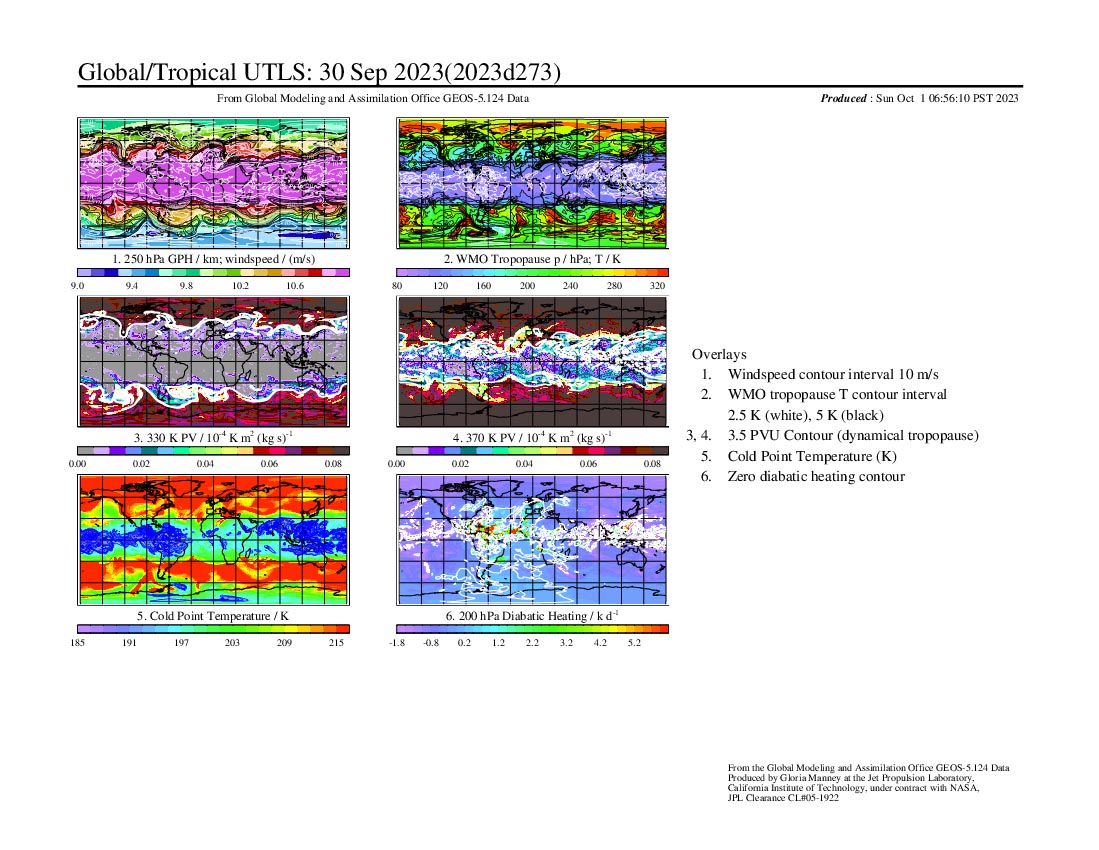
Upper Troposphere / Lower Stratosphere Daily Maps
These are maps of of GPH, windspeed, tropopause, PV, cold point temperature, diabatic heating rates, 200 hPa divergence, and 200 hPa velocity potential. |
Bi-Weekly Meteorological Reports
Contact Gloria Manney

|
These slides are prepared every two weeks (excepting holidays/vacations) and presented at the MLS team meetings to provide an update on stratospheric and UTLS meteorological conditions and how they affect the MLS composition measurements. They focus mainly on the winter stratospheric polar vortices. |
Ozone Hole Cutout
Contact: Luis Millan

|
This is a paper cutout of the 2006 southern hemisphere ozone hole that can gives a picture of what the ozone hole looks like when it is observed by MLS. This can be used as an educational aid to illustrate ozone science. The ozone layer is a blanket 16 to 50 km (10 to 31 miles) above the Earth surface that protects us from harmful ultraviolet light from the sun. In the 1980s scientists found out that the ozone layer was being destroyed by industrial chemicals. NASA satellites such as the Microwave Limb Sounder enable scientists to study ozone and many of the key gases involved in its destruction. |